Data Tables- Data tables should include a title (relating to the data), columns and rows with headings, and data from the experiment.
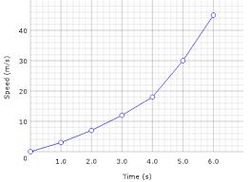
Scientific Graphs- Scientific Graphs should include a title, a x-axis (independent variable) and y-axis (dependent variable.) The x and y axes should be labeled and numbered in consistant numerical units. The units of measurement (inches, cm, meter, ... ) also need to be indicated. Scientific Graphs should also be LINE GRAPHS. It should represent data from the experiment.
Scientific Graphs- Scientific Graphs should include a title, a x-axis (independent variable) and y-axis (dependent variable.) The x and y axes should be labeled and numbered in consistant numerical units. The units of measurement (inches, cm, meter, ... ) also need to be indicated. Scientific Graphs should also be LINE GRAPHS. It should represent data from the experiment.